
Contents
1.0 Exploratory Data
Visualization
1.8 Characteristics of the Top
App Developer Companies
1.10 Rated Apps Rating
Distribution
2.1 Summary Statistics of the
numeric variables
2.1.2 Feature statistics of
the sample:
2.2 Distribution of the
Ratings in sample data
2.2.3 Whether the App supports
Ads
2.3 Correlations of the numeric
variables
2.5.1 Feature Statistics of
Outliers
2.6.2 Scatter Plot of the
Highly Correlated Features
2.7 Unsupervised Machine
Learning
3.0 Supervised Machine
Learning
3.1 Target Variable
(Rated/Unrated)
3.5 Model Comparison by AUC
(Area Under the Curve)
3.8 Target Variable (App
Rating)
0.0
Dataset
0.1
Source
Google Play Store Apps | Kaggle
0.2
Variables
Contains data of 600k+ Google Play Store Android App. The data was updated on June 2021. It as 2.3 million+ rows and 24 columns/attributes. The following attributes are present. Not all of the attributes were used for data analysis.
|
Time/Period |
Nominal Variables |
Categorical Variables |
Numerical Variables |
|
Released |
App Id |
Category |
Installs |
|
Last Updated |
App Name |
Minimum Installs |
Maximum Installs |
|
Developer Id |
Currency |
Price |
|
|
Developer Website |
Minimum Android |
Rating Count |
|
|
Privacy Policy |
Content Rating |
Size |
|
|
Developer Email |
Ad Supported |
||
|
In app purchases |
|||
|
Editor Choice |
|||
|
Rating |
|||
0.3
Working Files
Link to Software Files: Google Drive
The link contains the software files for Tableau, and Orange used in this assignment.
1.0
Exploratory Data Visualization
1.1
App Release Pattern
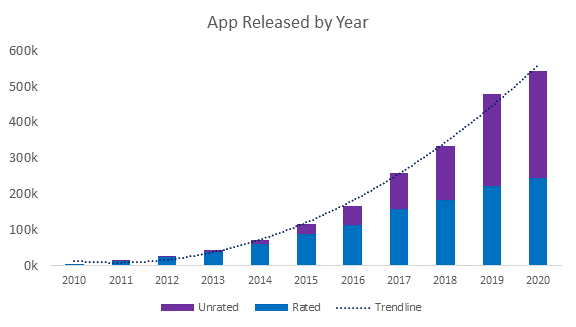
Insights: The total number of apps released have increased at an increasing rate. We can expect more apps to be released in the coming years based on the pattern.

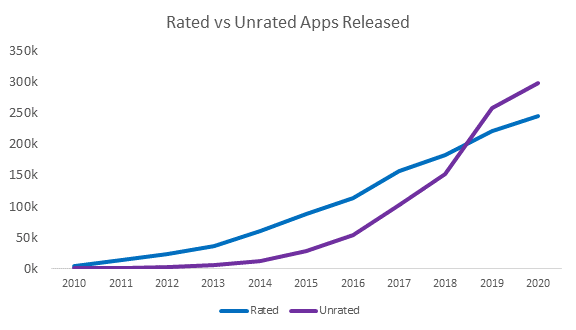
Insights: However, unrated apps have increased at a faster rate than rated apps. Although, the proportion of unrated apps was very low in the first few years of play store, the number of unrated apps was greater than rated ones by 2019.
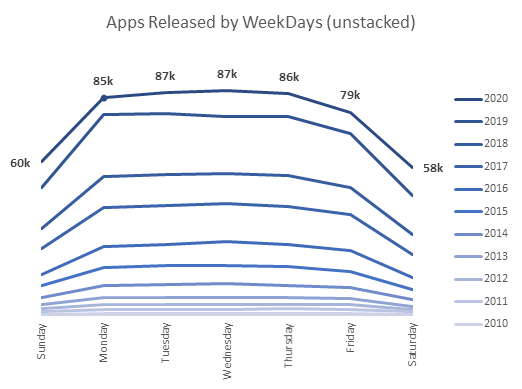
Insights: Less apps are released on the weekends comparatively. This pattern has been seen on every year. Furthermore, the rate of releases seems to increase till Wednesday, before starting to drop again.
1.2
Updating Apps
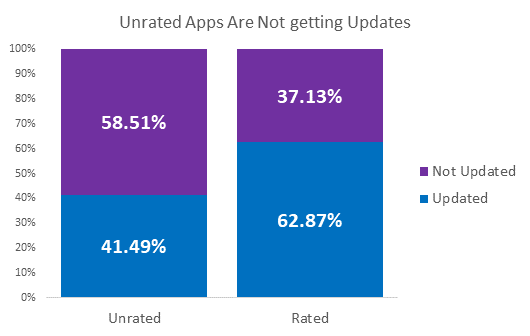
Insights: When an app is not rated there is around 60% chance that it was not updated in the future. In the case of rated apps, 60% get updated eventually. (in making the chart, apps released till 2019 were taken, as apps released later might not have gotten time to get updated)
1.3
Ad placement in Apps
Top Categories Without Apps
|
Category |
Ad not Supported |
Ad Supported |
|
Business |
87% |
13% |
|
Shopping |
82% |
18% |
|
Events |
75% |
25% |
|
Medical |
75% |
25% |
|
Finance |
75% |
25% |
Insights: None of the categories having less ads were games. Furthermore, these categories are service oriented that might require financial transactions, and ads need not be placed for extra revenue.
Top Ad Supported Categories
|
Category |
Ad not Supported |
Ad Supported |
|
Racing |
9% |
91% |
|
Word |
11% |
89% |
|
Simulation |
11% |
89% |
|
Trivia |
12% |
88% |
|
Music |
13% |
88% |
Insights: Categories that include many apps with ads are “games”. Furthermore, there might be less options for in-app purchase in such categories, hence ads are placed for revenue generation (disambiguation: music category is a games category, “music and audio” is a non-game category)
1.4
Apps & Android Version
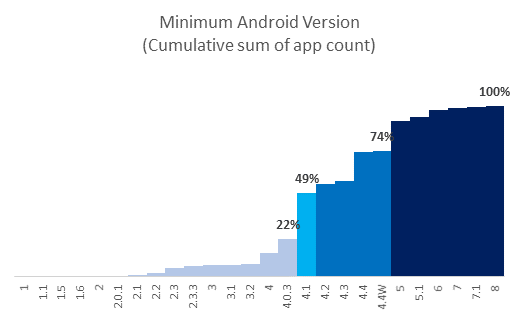
Insights: Only 22% apps can be run on android version below 4.1. On the contrary, only 26% apps restrict android versions below 5. We can expect, that when new android versions will be released, there will be more apps that would not be usable in older phones. Android users can consider buying a phone with higher android version based on the insight.
1.5
App Rating
App Ratings
|
Category Type |
Good (4 or above) |
Bad (below 4) |
Unrated |
|
Games |
42% |
24% |
34% |
|
Others |
35% |
17% |
48% |
|
Grand Total |
36% |
18% |
46% |
Insights: About half of the apps that are not games remain unrated. Whereas, there is only a 1 in 3 probability that a game app will go unrated.
App Ratings (Rated Apps)
|
Category Type |
Good (4 or above) |
Bad (below 4) |
|
Games |
64% |
36% |
|
Others |
67% |
33% |
|
Grand Total |
67% |
33% |
Insights: However, for rated apps, we see that similar proportion of apps got rated above 4. One explanation might be that, games categories do not have as many apps as the other ones. Hence, they do not go unnoticed often. When the apps are noticed by people, similar ratings are available for games and other categories.
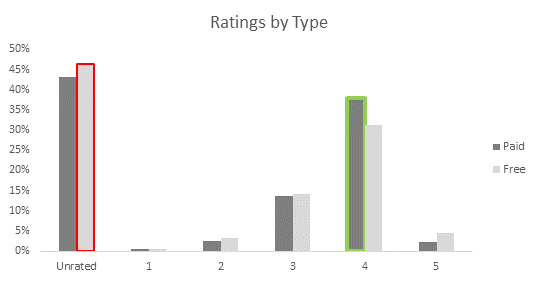
Insights: Paid apps are rated better than the free ones (green highlight). At the same time, free apps are more unrated in comparison to the paid ones. (Rating 5 is not being considered as rating 5 is easily possible through a small number of rating by the owners or their friends. The ‘ratings vs installs” chart provided later confirms this assumption)
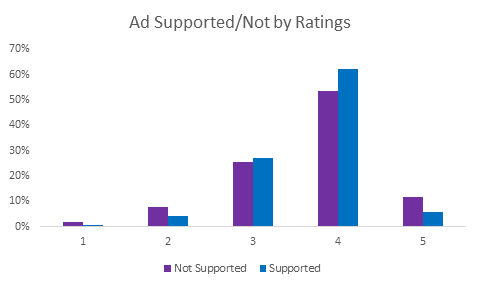
Insights: Ad supported apps have higher proportion of good ratings and a lower proportion of bad ratings.
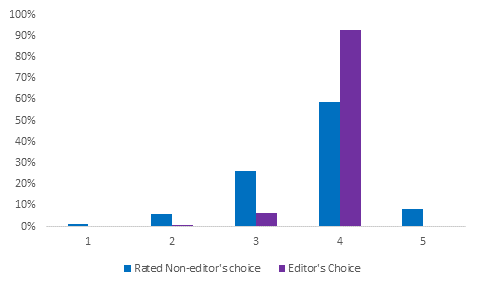
Insights: A greater portion of Editor’s Choice apps get a better rating when compared to apps not labeled editor’s choice.
1.6
App Category
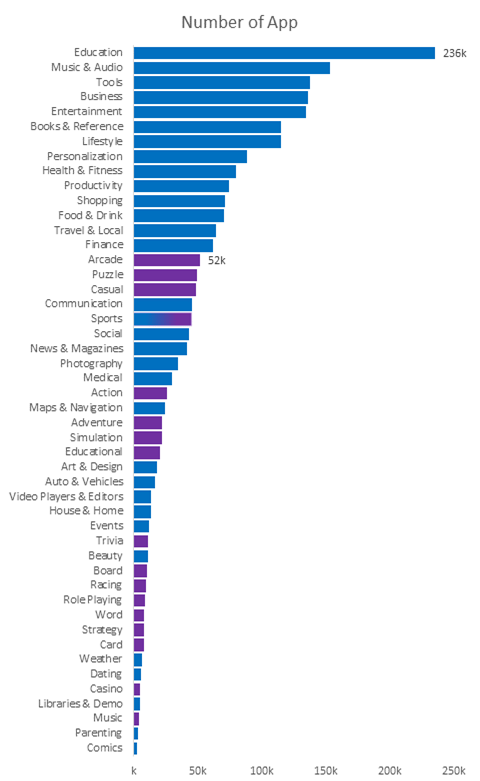
Insights: Education category has the highest number of apps.
The first games category (15th overall) in the descending order of
app counts is “Arcade” with less than 1/4th of education category
apps.
Comics category has the least
number of apps. Whereas, Music category is the games category with the lowest
number of apps.
1.7 Revenue Generating Apps
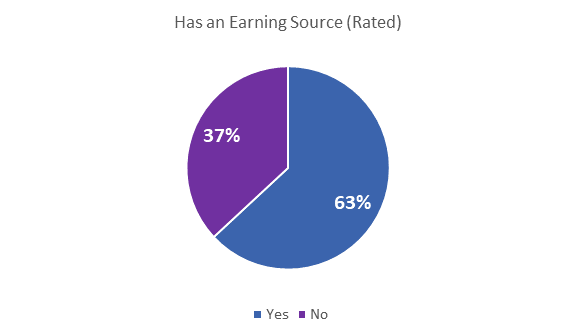
Insights: There were 3 earning sources identified in this case:
ads, in-app purchase and paid apps. 37% of the play store apps did not have any
of those as an earning source. (Unrated apps were not used in this analysis).
1.8 Characteristics of the Top App Developer Companies
|
Developers with 1000+ Apps |
Avg. Rating (Rated Only) |
Rated |
Unrated |
|
app smart GmbH |
4.43 |
26% |
74% |
|
Apptegy |
4.24 |
7% |
93% |
|
ArtStyle |
4.33 |
8% |
92% |
|
BH App Development Ltd |
4.07 |
1% |
99% |
|
Branded Apps by MINDBODY |
4.20 |
15% |
85% |
|
Branded MINDBODY Apps |
3.59 |
3% |
97% |
|
ChowNow |
3.74 |
6% |
94% |
|
Currency Converter X Apps |
4.51 |
14% |
86% |
|
CyJ Studio |
4.30 |
5% |
95% |
|
Echurch |
4.88 |
27% |
73% |
|
Flipdish |
3.87 |
9% |
91% |
|
FoodSoul |
4.04 |
33% |
67% |
|
J&M Studio |
3.96 |
4% |
96% |
|
Lingua Apps |
4.20 |
30% |
70% |
|
Magzter Inc. |
3.86 |
41% |
59% |
|
MINDBODY Branded Apps |
4.15 |
8% |
92% |
|
Multiple Radios Online AM FM Free - Apps |
3.94 |
3% |
97% |
|
OrderYOYO |
4.39 |
8% |
92% |
|
Phorest |
4.51 |
2% |
98% |
|
Sharefaith |
4.88 |
7% |
93% |
|
Skalpelis |
3.18 |
4% |
96% |
|
Subsplash Inc |
4.84 |
44% |
56% |
|
TRAINERIZE |
4.06 |
2% |
98% |
|
TTMA Apps |
4.26 |
27% |
73% |
|
Virtuagym Professional |
4.70 |
57% |
43% |
|
+Home by A team |
4.43 |
98% |
2% |
Insights: Among the app developers with 1000+ apps, +Home by A
team seems to be the best in terms of getting noticed (98% rated apps).
Contrarily BH App Development Ltd are the worst in terms of at least getting
rated (1% rated apps). Echurch and Sharefaith are the best with high average of
rated apps. Interestingly, both of them are related to religious practices. It
is also noticeable that a most of these developers developing thousands of apps
did not keep quality in mind.
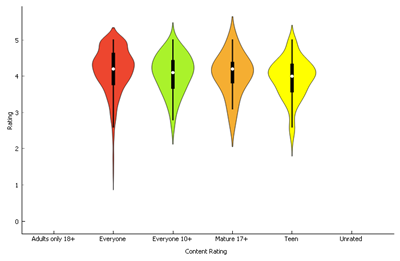
1.9 Content Rating
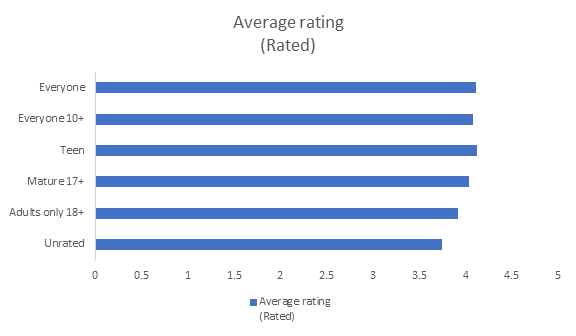
Insight: As the age limitation increases, the average rating
decreased.
Number of Apps by
Content Rating
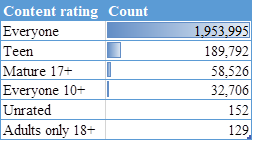
Insight: At the same time, the number of age restricted apps
are less in comparison to apps with content rating “Everyone”
1.10 Rated Apps Rating Distribution
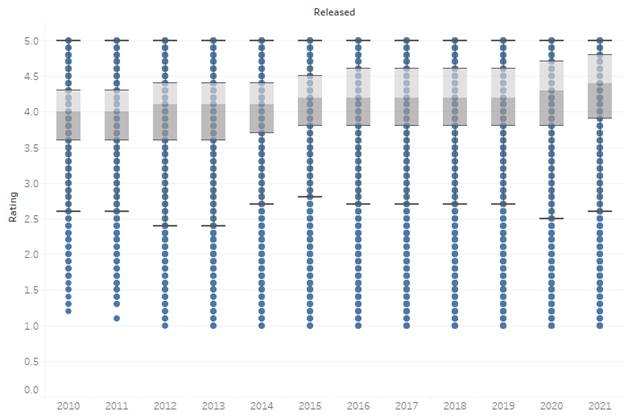
Insights: The overall rating distribution for apps are shown
above. The median rating has increased over time consistently, which is a good
sign of the increasing quality of apps. However, the lower quartile range
fluctuated with no specific pattern.
1.11 Number of Installs
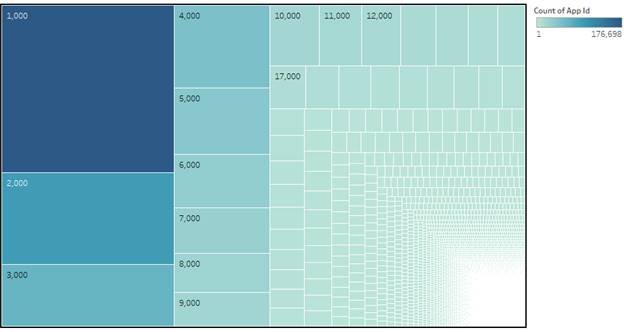
Insights: Lesser number of apps have high volume of downloads.
Most apps have a small number of downloads.
1.12 Paid Apps
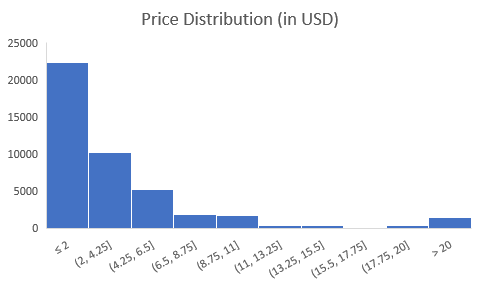
Insights: The price distribution for paid apps have been shown
above. Most of the apps are priced under $2. Prices can get as high as $400,
but they have a lower frequency.
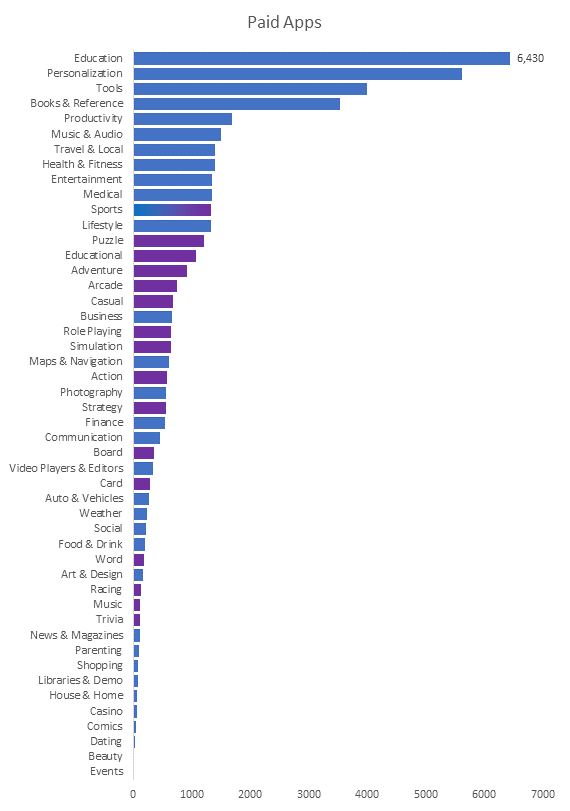
Insights: Education category has the highest number of apps that
are paid. Puzzle category is the most common paid games category.
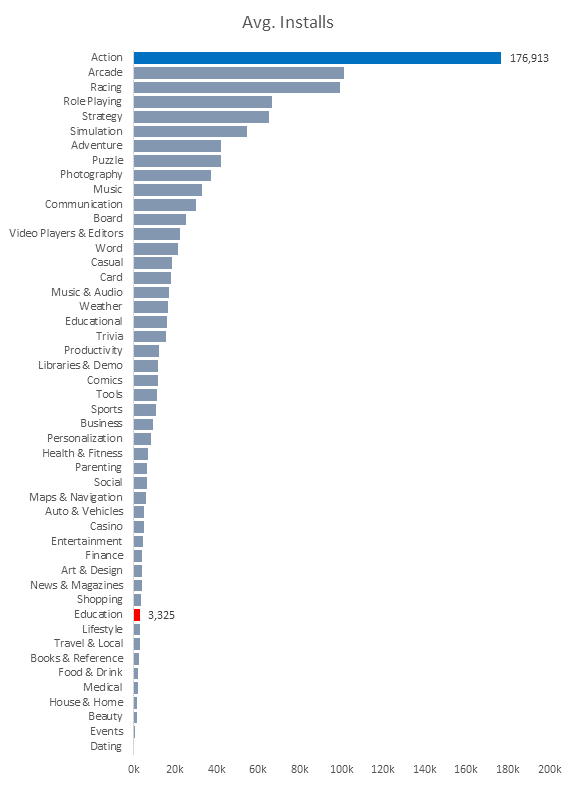
Insights: Although education category has the highest number of
paid apps, they are not installed as much. Arcade categories have a higher
average number of installs in comparison instead.
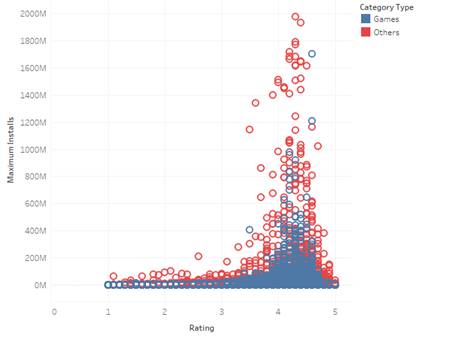
1.13 Ratings vs Installs
Insights: Higher number of installs are found for apps rated
slightly above 4. However, not many of the apps with high downloads are rated
as high.
Ratings vs Installs
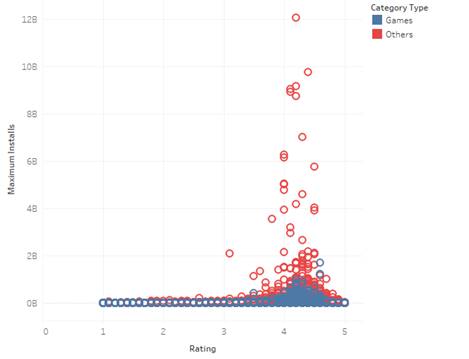
Zoomed In to 2 Billion Downloads
A closer look shows how most
apps are rated between 4 and 5. Furthermore, rating 5 did not necessarily mean
a high number of users for the app.
1.14 App Size
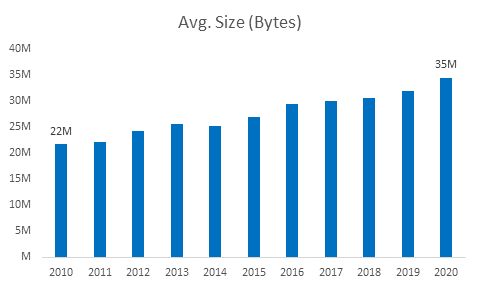
Insights: The average size of apps have increased over the
time. The apps now have grown more than 50% in size on an average.
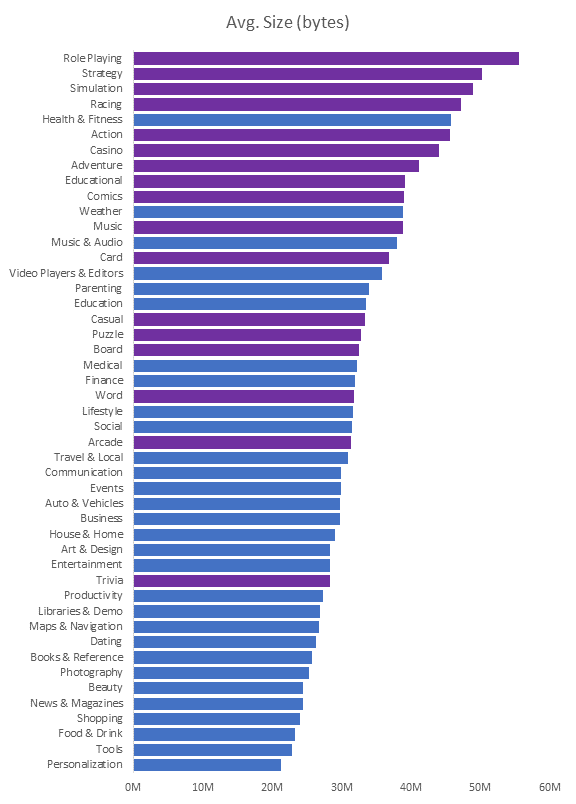
Insights: The games categories have greater size on average. 9
of the 10 categories from the top were games
2.0 Exploratory Data Analysis
2.1 Summary Statistics of the numeric variables
2.1.1 Feature Statistics
|
Feature |
Mean |
Median |
Dispersion |
Min. |
Max. |
Missing |
|
Size (bytes) |
31,867,838 |
24,000,000 |
0.85 |
10,000 |
1,020,000,000 |
1,095,684 |
|
Install Plus |
113,540 |
100 |
76.88 |
0 |
10,000,000,000 |
0 |
|
Rating |
2.20 |
3 |
0.96 |
0 |
5 |
0 |
|
Rating Count |
2,760 |
6 |
72.02 |
0 |
138,557,570 |
0 |
|
Maximum Installs |
308,117 |
706 |
71.69 |
0 |
12,057,627,016 |
0 |
|
Price |
0 |
0 |
25.40 |
0 |
400 |
0 |
|
Released |
1/28/2010 |
6/16/2021 |
0 |
|||
|
Last Updated |
2/9/2009 |
6/16/2021 |
0 |
2.1.2 Feature statistics of the sample:
As the data was very large,
they could not be analyzed directly through analysis. Hence, the focus was
shifted to rated Games only, and a sample was created using Data Sampler from
Orange with only 1000 data. The rest of the analyses were done based on this
data.
|
Feature |
Mean |
Median |
Dispersion |
Min. |
Max. |
Missing |
|
Size (bytes) |
40,939,499 |
33,000,000 |
0.74 |
12,000 |
1,020,000,000 |
45,757 |
|
Install Plus |
355,281 |
1,000 |
13.03 |
0 |
1,000,000,000 |
0 |
|
Rating |
4.1 |
4.2 |
0.15 |
1 |
5 |
0 |
|
Rating Count |
12,147 |
55 |
26.04 |
5 |
89,177,097 |
0 |
|
Maximum Installs |
930,366 |
8,385 |
11.32 |
0 |
1,704,495,994 |
0 |
|
Price |
0 |
0 |
17.33 |
0 |
400 |
0 |
|
Released |
|
|
|
2/26/2010 |
6/27/2021 |
0 |
|
Last Updated |
|
|
|
12/28/2010 |
6/15/2021 |
0 |
2.2 Distribution of the Ratings in sample data
2.2.1 Overall
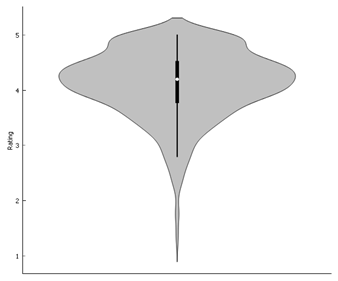
Most apps get rated slightly
above 4.
2.2.2 By Category
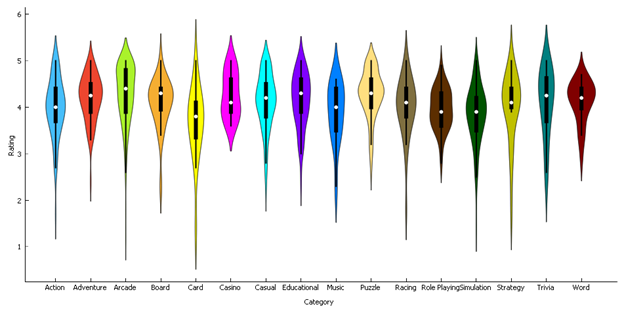
In the sample, some
categories are more distributed than the others. Casino category was
less distributed whereas Card category was more distributed than the
rest. The average rating of each category looks different.
2.2.3 Whether the App supports Ads

Apps not supporting apps have
greater variations of rating than those which supports ad.
2.2.4 By Content rating
The distributions of age
restricted apps look similar to each other but different from apps without
restrictions. Age restricted apps were neither rated too high, nor too low in
the sample.
2.2.5 Editor’s Choice Apps
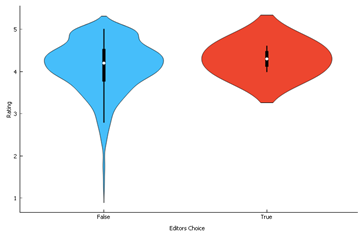
Editor’s choice Apps do not
seem to have very low ratings.
2.2.6 Free Apps
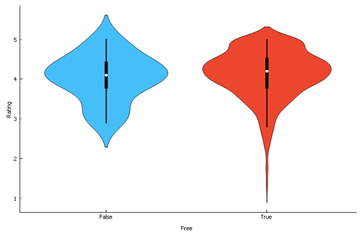
Paid apps do not seem to have
very low ratings as seen in free apps.
2.3 Correlations of the numeric variables
|
Feature 1 |
Feature 2 |
Correlation |
False Discovery Rate |
|
Maximum Installs |
Rating Count |
+0.69 |
5.83E-142 |
|
Last Updated |
Released |
+0.60 |
3.42E-97 |
|
Last Updated |
Size (bytes) |
+0.24 |
4.21E-14 |
|
Released |
Size (bytes) |
+0.18 |
2.15E-08 |
|
Rating Count |
Released |
-0.12 |
0.00028789 |
|
Maximum Installs |
Released |
-0.12 |
0.000295943 |
|
Last Updated |
Maximum Installs |
+0.12 |
0.000420386 |
|
Price |
Released |
-0.11 |
0.00185623 |
|
Last Updated |
Rating Count |
+0.09 |
0.0102406 |
|
Rating |
Size (bytes) |
-0.08 |
0.0162556 |
|
Rating |
Released |
+0.08 |
0.0206284 |
|
Maximum Installs |
Size (bytes) |
+0.07 |
0.0322879 |
|
Rating Count |
Size (bytes) |
+0.05 |
0.236459 |
|
Rating |
Rating Count |
+0.04 |
0.307187 |
|
Last Updated |
Rating |
+0.04 |
0.307187 |
|
Last Updated |
Price |
-0.02 |
0.619583 |
|
Maximum Installs |
Price |
-0.02 |
0.671249 |
|
Price |
Rating |
+0.01 |
0.817149 |
|
Maximum Installs |
Rating |
+0.01 |
0.817149 |
|
Price |
Size (bytes) |
+0.01 |
0.859692 |
|
Price |
Rating Count |
-0.01 |
0.859692 |
There is a weak correlation
between most of the features. The only two good correlations are not relevant
to app ratings. The strong correlation between the number of installs and the
number of ratings is visualized in the following.
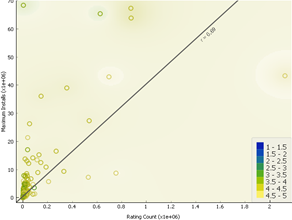
High Correlation
Scatter Plot
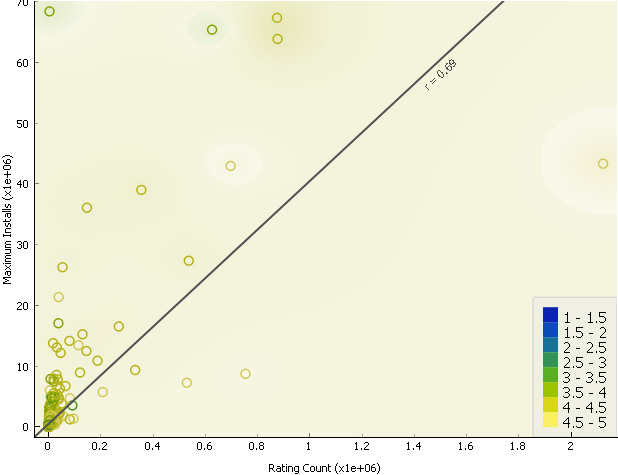
Number of ratings are high
when installs are more. There is a correlation of 0.69 between these two.
2.4 ANOVA and T-Test
2.4.1 T-Test
Ratings by Free Apps
H0: There is no difference in rating
between free and paid apps
H1: Ratings are significantly different
between the groups
In the following figure, True means Free Apps, whereas
False means Paid.
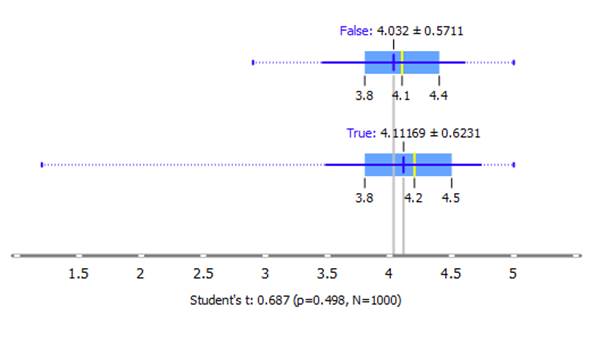
Result:
t= 0.687 (two-tailed, p=0.498, N=1000)
The null hypothesis is not rejected.
The result is not significant at p < .05
That is, app rating does not depend on whether it is
free or not.
Installs by Free Apps
H0: There is no difference in the number of
installs between free and paid apps
H1: Installs are significantly different
between the groups
In the following figure, True means Free Apps, whereas
False means Paid.
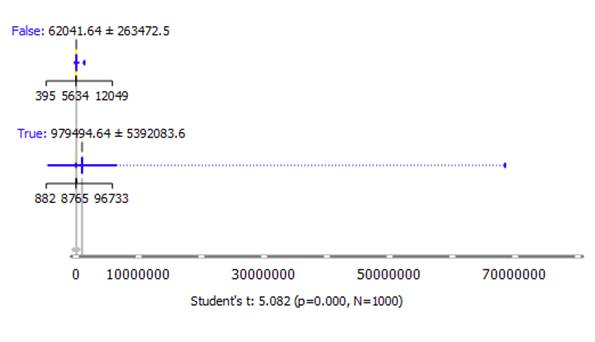
Result:
t=5.082 (two-tailed, p=0.000, N=1000)
The null hypothesis is rejected.
The result is significant at p < .05.
That is, a significant difference exists. From the box
plot, free apps have a higher number of installs.
Size by Updated Apps
H0: Size of apps are not dependent on
whether apps have been updated or not
H1: Size of the apps are significantly
different between the groups
In the following figure, True means Updated, whereas
False means Not Updated.
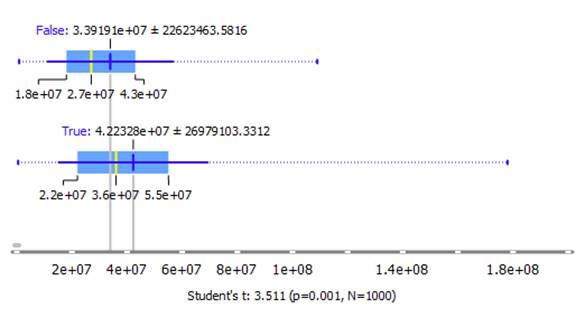
Result:
t = 3.511 (two-tailed, p=0.001, N=1000)
The null hypothesis is rejected.
The result is significant at p < .05.
That is a significant difference exists. From the box
plot, updated apps have a higher app size compared to those that are not.
2.4.2 ANOVA
Rating by Category
H0: The mean
ratings for all categories are equal.
H1: The sample
means are not all equal
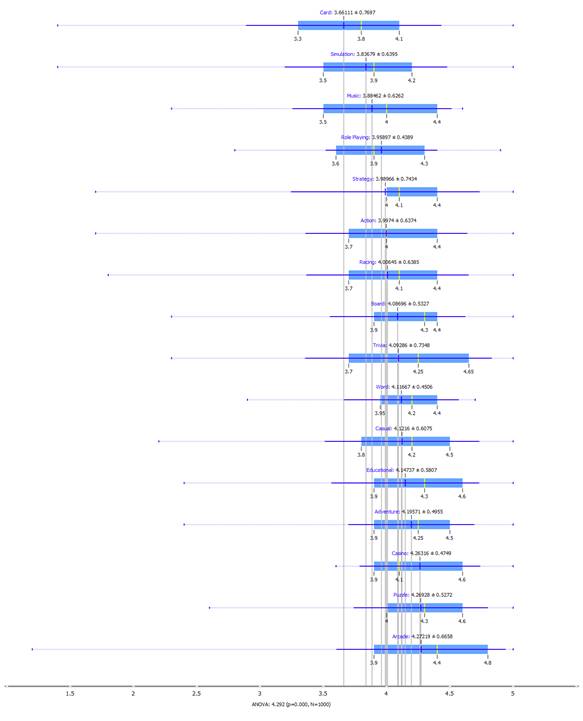
Result: ANOVA= 4.292 (p=0, N=1000)
For p=0.0, we can reject the
null hypothesis. Therefore, the ratings are dependent on the categories for
at least one of them.
Install
H0: The mean
number of installs for all categories are equal.
H1: The sample
means are not all equal
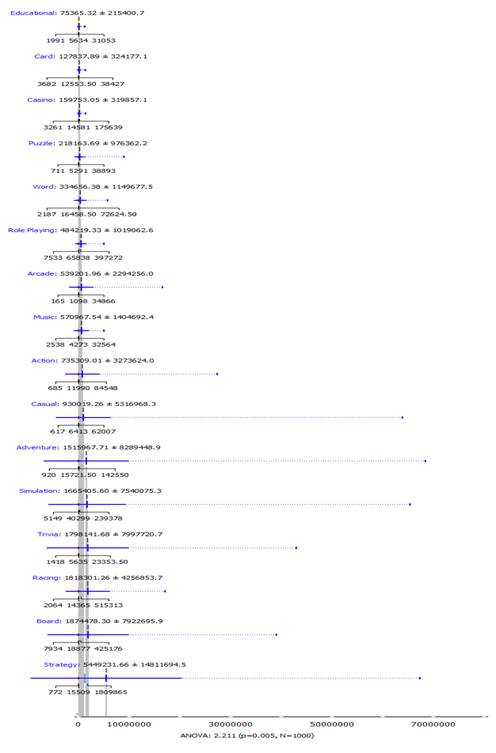
Result: ANOVA= 2.211 (p=0.005, N=1000)
For p=0.005, we can reject
the null hypothesis. That is, the number of installs vary depending on the
categories.
2.5 Outlier Detection
2.5.1 Feature Statistics of Outliers
The outlier’s that were
common through 3 methods Covariance Estimator (100 outliers), Local Outlier
Factor (100 outliers), and Isolation Forest (90 outliers) were chosen. A total
of 15 rows were found common as outliers.
|
Feature |
Mean |
Median |
Dispersion |
Min. |
Max. |
Missing |
|
Size (bytes) |
78,090,909 |
77,000,000 |
0.45 |
36,000,000 |
151,000,000 |
4 |
|
Rating |
4 |
4 |
0.08 |
4 |
5 |
0 |
|
Rating Count |
399,610 |
144,367 |
1.40 |
3,269 |
2,122,374 |
0 |
|
Maximum Installs |
32,354,101 |
26,272,965 |
0.74 |
1,268,404 |
68,398,433 |
0 |
|
Price |
0 |
0 |
0 |
0 |
0 |
|
|
Released |
44,373 |
43,848 |
0 |
|||
|
Last Updated |
43,437 |
44,362 |
0 |
2.6.2 Scatter Plot of the Highly Correlated Features
The highly correlated
features are used below to show how the outliers are different.
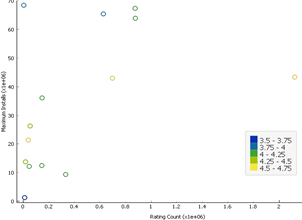
All
Outlier’s only
Most outliers remained above
the regression line, which denotes high installs with a very low number of
ratings given. Excluding such outliers may increase correlation.
2.6 RADVIZ
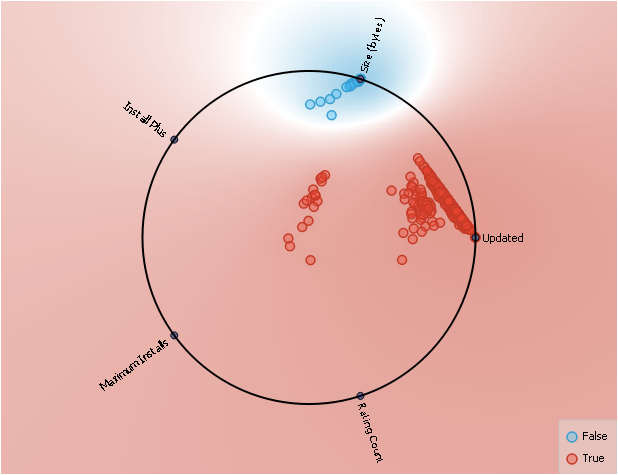
Of the features related to
App Ratings, app size was relevant when, the app had not been updated.
2.7 Unsupervised Machine Learning
2.7.1 K-means Clustering
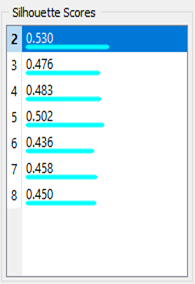
2 clusters were made as it showed the highest silhouette score.
As shown in the chart below, clusters can be separated somewhat distinctively.
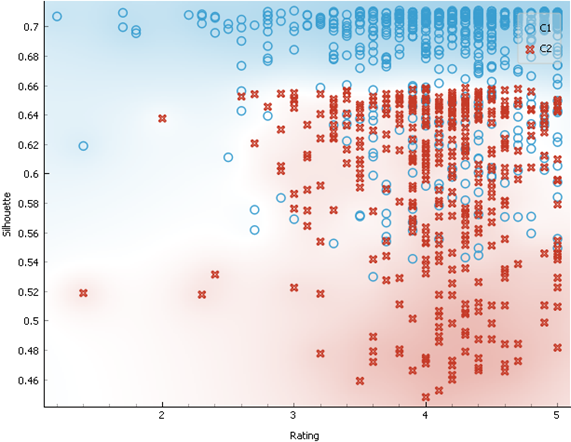
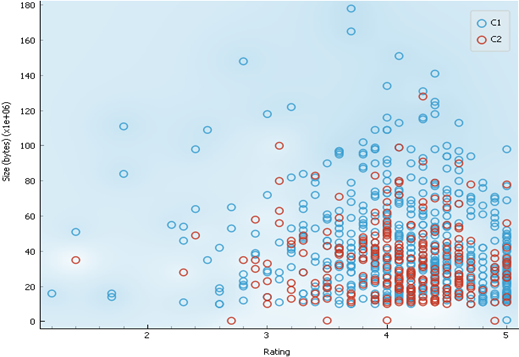
2.7.2 Cluster Characteristics
1. According to the chart below, cluster 1 can have
very high app size, compared to cluster 2
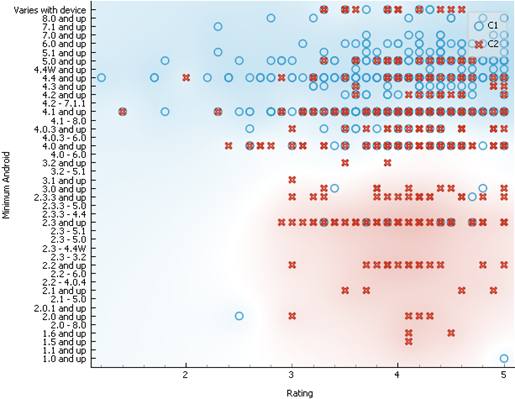
2. According to the chart, cluster 2 consists of apps
that support older app version. Whereas, cluster 1 consists of apps that are
supported by only newer app versions.
3.0 Supervised Machine Learning
Type – 1
3.1 Target Variable (Rated/Unrated)
We will be checking whether
an app gets rated or not and what models best predict such getting rated.
3.2 Removal of Collinearity
Ratings, and Rating Counts
have been removed as they directly indicate whether an app is rated or not. For
example, 0 rating means an app is unrated or, if the number of rating is 0, it
means it was not rated. Last update date has been removed as it is highly
related to the date of release. Categories have been brought under broader
categories of Games vs Others.
3.3 Data Sampling
1000 data rows have been
taken with random sampling. The proportion of rated and unrated apps were about
1:1 in the original set, hence no change was required to make the data sample
more balanced.
3.4 Model Evaluation Results
|
Model |
AUC |
CA |
F1 |
Precision |
Recall |
|
Constant |
0.496 |
0.537 |
0.375 |
0.288 |
0.537 |
|
SGD |
0.500 |
0.515 |
0.495 |
0.503 |
0.515 |
|
SVM |
0.521 |
0.466 |
0.326 |
0.506 |
0.466 |
|
kNN |
0.577 |
0.563 |
0.563 |
0.563 |
0.563 |
|
AdaBoost |
0.731 |
0.733 |
0.733 |
0.733 |
0.733 |
|
Tree |
0.808 |
0.809 |
0.809 |
0.810 |
0.809 |
|
Random Forest |
0.879 |
0.812 |
0.812 |
0.812 |
0.812 |
|
Naive Bayes |
0.895 |
0.832 |
0.832 |
0.832 |
0.832 |
|
Logistic Regression |
0.896 |
0.783 |
0.779 |
0.828 |
0.783 |
|
Gradient Boosting |
0.910 |
0.836 |
0.836 |
0.837 |
0.836 |
|
Stack |
0.913 |
0.835 |
0.842 |
0.865 |
0.821 |
The blue highlights represent
a better performance by a model, compared to red ones. There is no single model
that predicts better than the others in terms of all the different scores.
3.5 Model Comparison by AUC (Area Under the Curve)
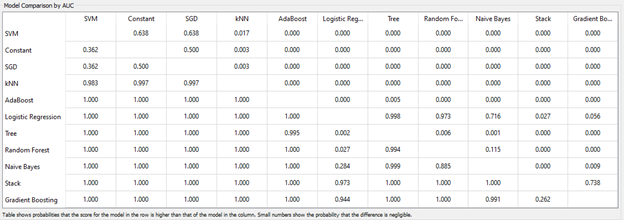
The above matrix shows the
probability that a model in the row is better than the model in the
corresponding column. From this matrix we can see that, the two models in the
bottom rows show 100% probability to be better than most other models.
3.6 Confusion Matrix
3.6.1 Summary
From the confusion matrices
mentioned in the next page, we can summarize the following about the models
that have been used.
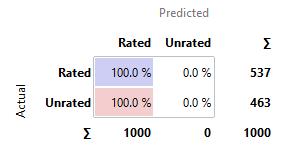
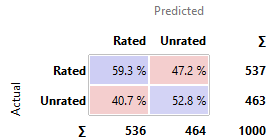
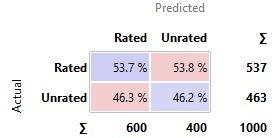
· kNN, SVM, and SGD perform similarly poor in comparison to the other
models. Their predictions are nearly as good as the constant model, with around
50-60% chances to have predicted correctly.
· AdaBoost, Tree, and Random Forest performed moderately well. But as significantly
better models were available, they are not focused as much.
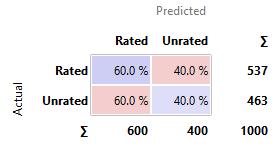
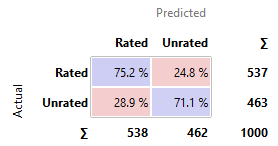
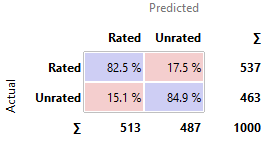
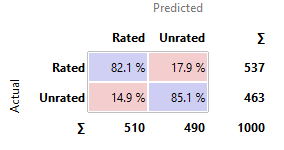
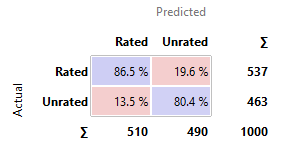
· Logistic Regression was the best model to predict rated apps. 94.4% of the
times, the app it predicts to be rated actually is rated.
·
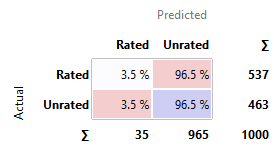
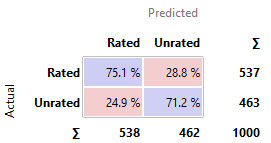
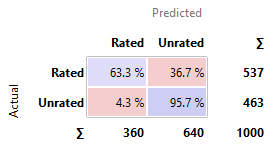
Naïve Bayes is the best in being accurate with its
unrated prediction. 81.6% of the times, if this model predicts an app to be
unrated, it actually is unrated.
·
Gradient Boosting is the best model overall based on AUC,
CA, F1, Precision, Recall scores. It has a good balance in predicting rated and
unrated apps.
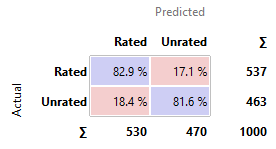
3.6.2 Bad Models
Constant
|
Proportion of actual |
Proportion of Predicted |
|
|
|
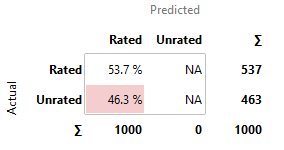
kNN
|
Proportion of actual |
Proportion of Predicted |
|
|
|
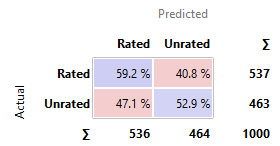
SVM
|
Proportion of actual |
Proportion of Predicted |
|
|
|
Stochastic
Gradient Descent
|
Proportion of actual |
Proportion of Predicted |
|
|
|
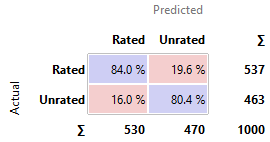
3.6.3 Moderately Good Models
AdaBoost
|
Proportion of actual |
Proportion of Predicted |
|
|
|
Tree
|
Proportion of actual |
Proportion of Predicted |
|
|
|

Random Forest
|
Proportion of actual |
Proportion of Predicted |
|
|
|
3.6.3 Good Models
Logistic
Regression
|
Proportion of actual |
Proportion of Predicted |
|
|
|
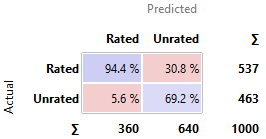
Comment: Apps are
the most likely to be actually rated when it is predicted to be rated by Logistic
Regression.
Gradient
Boosting
|
Proportion of actual |
Proportion of Predicted |
|
|
|
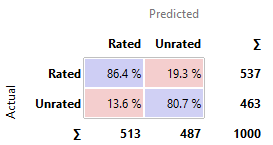
Comment: Best model
overall.
Naïve
Bayes
|
Proportion of actual |
Proportion of Predicted |
|
|
|
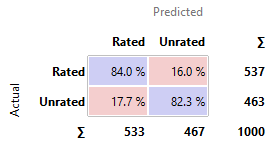
Comment: Apps are
the most likely to be actually unrated when it is predicted to be unrated by
Naïve Bayes.
3.7 Combining Models
3.7.1 Stacking Models
Based on the confusion
matrices, Gradient boosting was paired with Logistic regression
and Naïve Bayes.
|
Proportion of actual |
Proportion of Predicted |
|
|
|
This model has slightly
better AUC than the best lone model, Gradient Boosting. It has a comparatively
lower precision and higher recall compared to Gradient Boosting.
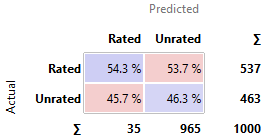
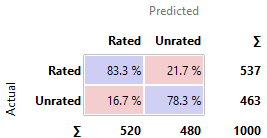
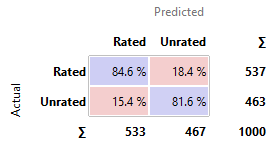
3.7.2 Setting Priorities
Based on the confusion
Matrices, we set priorities on which models will predict rated or unrated apps
in the following order.
1.
Logistic Regression will be used to
predict Rated apps only
2.
From the remaining apps, Naïve Bayes
is used for predicting unrated apps
3.
From the remaining apps, the
predictions from Gradient Boosting are used.
|
Proportion of actual |
Proportion of Predicted |
|
|
|

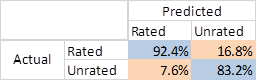
Based on the table above,
this combined model predicts both the rated and unrated apps better than all
other models.
Hence, the model
mentioned above, that uses three models on priority basis should be used.
Type – 2
3.8 Target Variable (App Rating)
We would attempt to predict
the app ratings.
3.9 Model Comparison
The errors from 5 models to
predict ratings were compared below.
|
Model |
MSE |
RMSE |
MAE |
R2 |
|
Linear Regression |
0.336 |
0.580 |
0.438 |
0.130 |
|
kNN |
0.307 |
0.554 |
0.425 |
0.206 |
|
SVM |
0.162 |
0.403 |
0.314 |
0.580 |
|
Gradient Boosting |
0.161 |
0.401 |
0.301 |
0.584 |
|
Random Forest |
0.077 |
0.277 |
0.186 |
0.802 |
Based on the comparison
table, Random Forest model gives the lowest error in all cases with R2
value of 0.808. This is the best model to among the five tested. On the
contrary, the Linear Regression method produced greater errors
while having a lower R2 value.
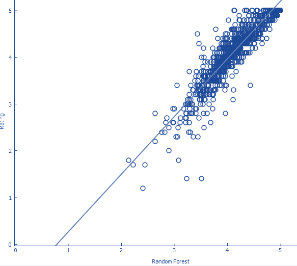
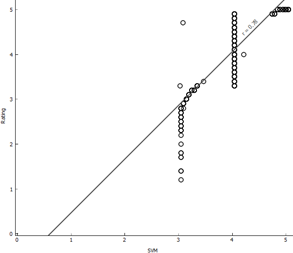
3.10 Visualizing Models
Below, the actual ratings are
plotted against the predicted ratings to understand how the predictions are different
from reality.
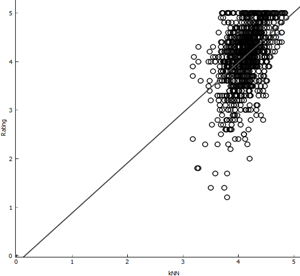
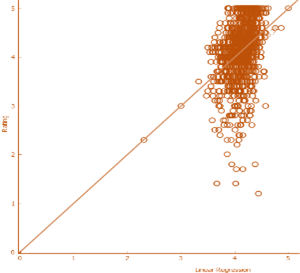
|
kNN |
Linear Regression (Bad fit) |
|
Random Forest (Best fit) |
SVM |
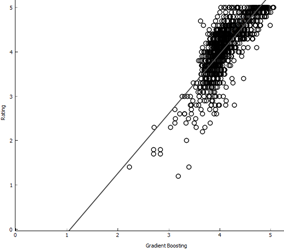
Gradient Boosting
As we can see, for Random
forest, SVM and Gradient Boosting the predicted ratings are close to actual
ratings. On the contrary, for linear regression and kNN the predicted values
are scattered very distantly.
Hence, for predicting
ratings, Random Forest is the better model.
END